Biography
In both my professional and personal life, I cherish deep connection, trust, exploration, and diversity. At work, I'm fueled by my passion for using data to tell compelling stories and express myself effectively. I find immense satisfaction in seeing my data narratives resonate with stakeholders beyond my field, empowering them to make informed decisions. I firmly believe that nurturing psychological safety within teams is the cornerstone of success.
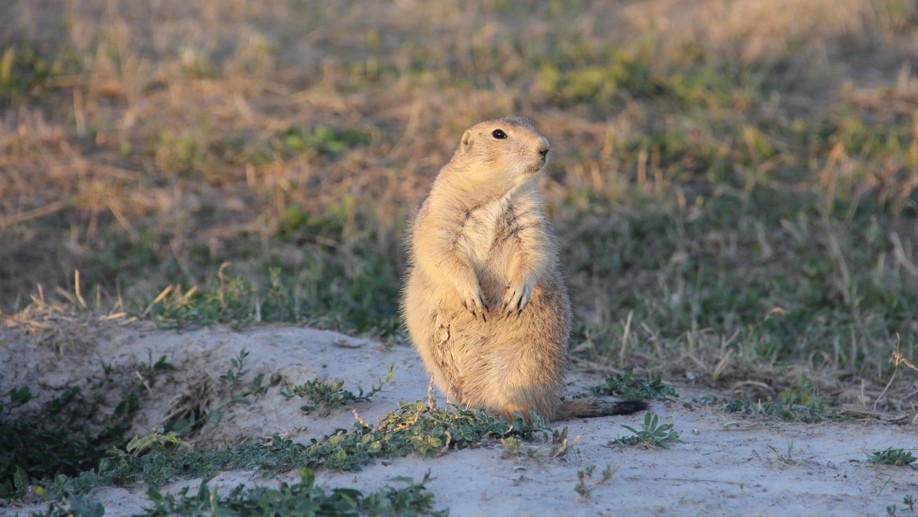
Outside of work, I'm all about embracing offline and offscreen activities. You'll often find me hiking with my beloved dog Peony, checking out comedy shows, immersing myself in art, and enjoying live musical performances. These experiences recharge me and inspire my creativity.
Interests
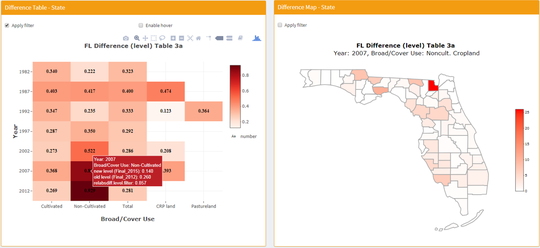
- Data Storytelling
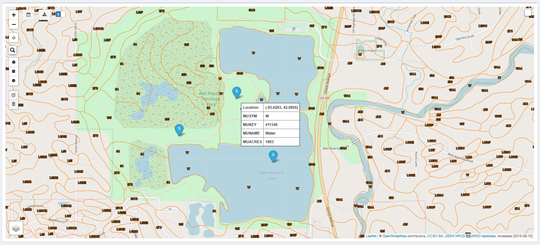
- Data Visualization
- Statistical Learning
Education
-
PhD in Statistics, 2020
Iowa State University, United States
-
BSc in Statistics, 2015
Wuhan University, China